V-Score
Project Introduction
European colocation and scale colocation data centers' power supply are projected to more than double between 2025 and 2030 (EUDCA, 2025). While 94% of their energy use reportedly comes from renewable sources, this fails to account for climate change-induced extreme weather events like heatwaves and droughts, which result in unanticipated fallback on fossil fuels (Ada Lovelace Institute, 2024). Similarly, cooling systems may increase water stress in already vulnerable regions.
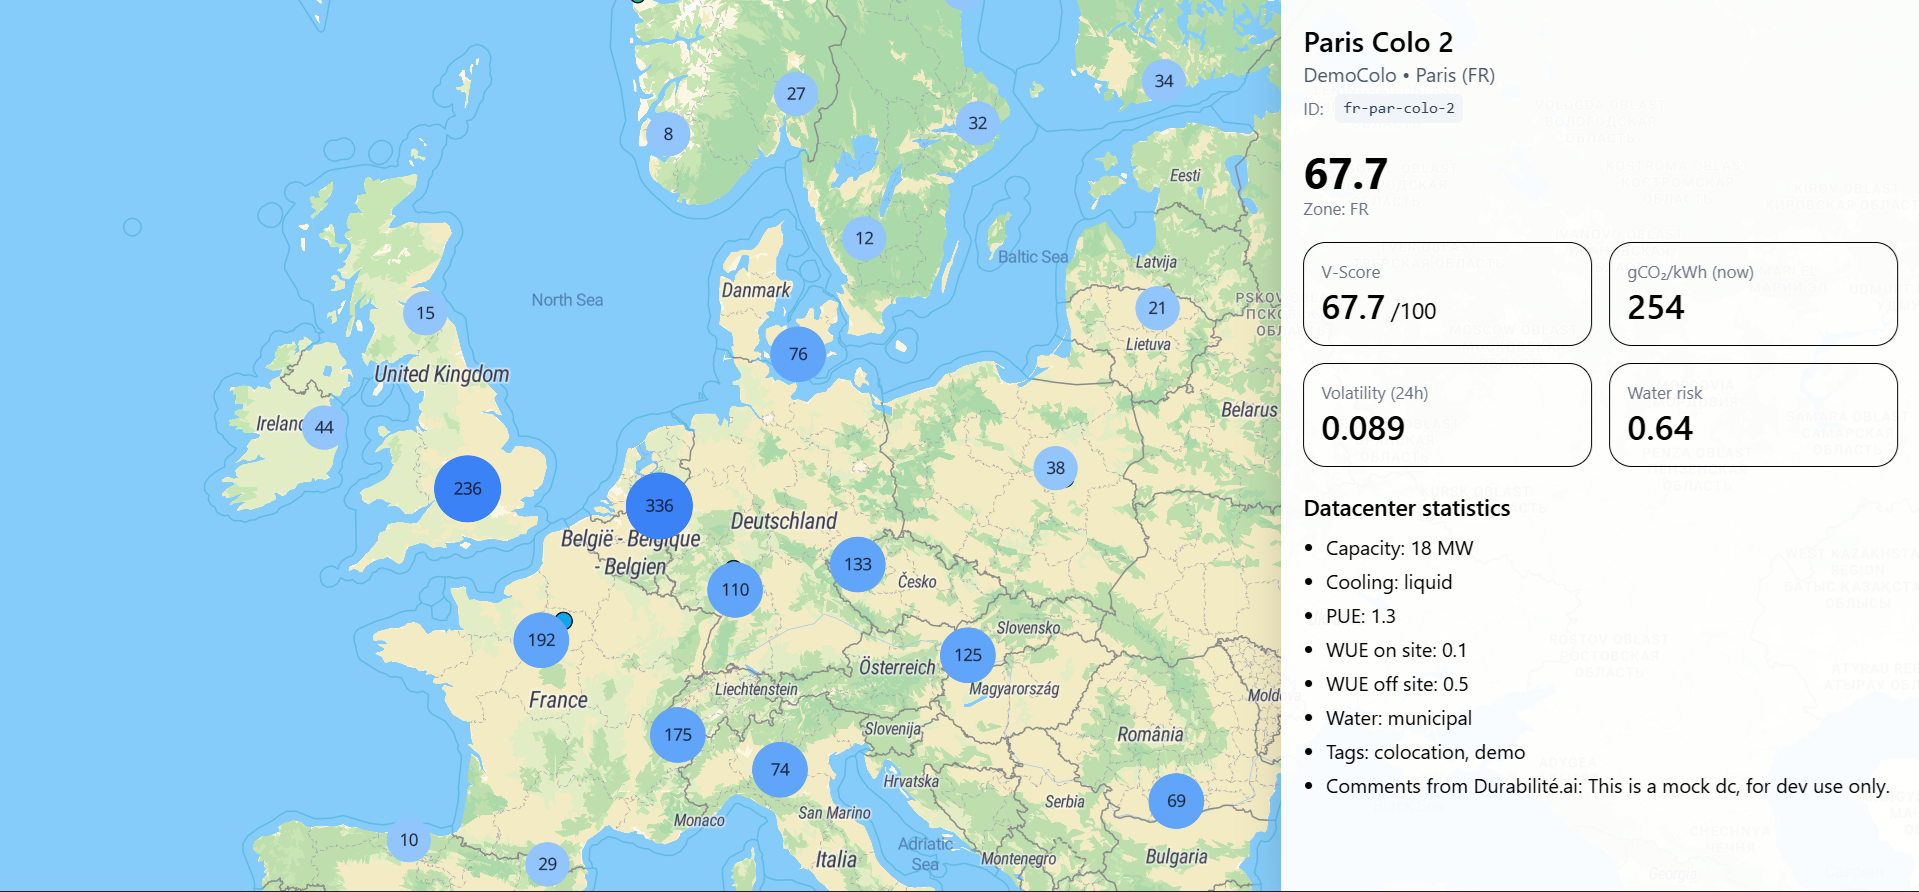
By integrating AI workload patterns, grid carbon intensity data, and climate stress scenarios, our project aims to help data centers remain green even in the face of climate uncertainty. We will develop interactive dashboards similar to a combination of Electricity Maps (2025) and the Energy and AI Observatory (IEA, 2025) on our website durabilite.ai. We will develop a "volatility-adjusted sustainability score" that presents AI environmental risks adjusted for extreme weather events. Our goal is to inform the European Commission's units in charge of the EU AI Act and the Energy Efficiency Directive to incorporate extreme weather event-induced AI carbon consumption in new legislations.
Demo

You can access our demo here. Please keep in mind that the enviornmental data are not yet ready and only serve as a demonstration.
Comparison to Existing Efforts
Currently implemented sustainability assessments in AI and digital infrastructure under the European Energy Efficiency Directive (EED) focus on static indicators like Power Usage Effectiveness (PUE), Water Usage Effectiveness (WUE), Energy Reuse Factor and Renewable Energy Factor (European Commission, 2025). However, these metrics are often blind to the dynamic interplay between weather extremes, energy demand, and fossil backup use.
For example, during heat waves, increased AI workloads may coincide with drops in nuclear output (due to warming cooling water) or solar performance, prompting coal plant activation. Our project addresses these gaps.
Water-related efforts (e.g., Ristic et al. 2015; Lei et al. 2023) highlight seasonal volatility in water availability. However, no study to date integrates water stress events and AI-driven compute surges. Our tool will do just that.
Existing tools like the IEA's Energy and AI Observatory or European Commission databases offer baseline reporting but lack predictive or crisis-responsive capabilities. None currently model carbon-intensive fallback behavior.
In sum, the blind spot around stress-induced fossil fallback and temporal volatility remains unaddressed. Our project shifts the focus from long-term averages to short-term crises, integrating grid behavior, AI demand, water stress, and carbon intensity in an actionable framework.
Technical Challenges Expected
1. Real-Time Carbon Intensity Mapping: The core challenge lies in identifying electricity carbon intensity during crises. For example, during cloud cover and heatwaves, fossil peaker plants may be activated. We'll access hourly grid emissions data from sources like Electricity Maps (2025), ENTSO-E, and national TSOs to map data center regions and model marginal emissions.
2. Water Risk Modeling: Water usage by AI systems is underexplored. While WUE metrics exist, they neglect local potable/industrial water sourcing and drought-proneness. Large models may consume up to 700,000 liters (Li et al., 2023). We will connect data center cooling systems to basin-level water stress indices using WRI's Aqueduct and develop a water risk index.
Ecosystem and Engagement
Industry Engagement: We will partner with data center operators, EUDCA, signatories of the Climate Neutral Data Centre Pact, and hyperscalers (Microsoft, Google, Mistral). Collaboration will involve interviews, anonymous reporting, and data-sharing.
Academic and Civil Society: We aim to integrate with OECD, IEA, Ada Lovelace Institute, Boavizta, Gen AI Impact, and others. Through open-source sharing, collaboration on indices, and joint publications, we will refine our model and build credibility.
Policy Engagement: We aim to inform policy units under the EU AI Act and EED. This includes webinars, public consultations, and evidence briefs. We will publish results via arXiv and present at conferences like the European and American Geoscience Unions.
References
- Ada Lovelace Institute. (2024). Data, AI and climate impact
- World Resources Institute. (2025). Water Risk Atlas
- Electricity Maps. (2025). Live CO₂ emissions map
- EUDCA. (2025). State of European Data Centres 2025. Download
- European Commission. (2024). Energy Efficiency Directive
- International Energy Agency. (2025). Energy and AI Observatory
- Lei, N., et al. (2022). Energy and sustainability of AI systems
- Li, Z., et al. (2023). Making AI Less Thirsty
- OECD. (2022). Measuring the Environmental Impacts of AI
- Patterson, D., et al. (2021). Carbon Emissions of Neural Networks
- U.S.-Asia Sustainable Development Foundation. (2024). AI Sustainability
- Ristic, B., et al. (2015). Environmental Impact of Cloud Computing